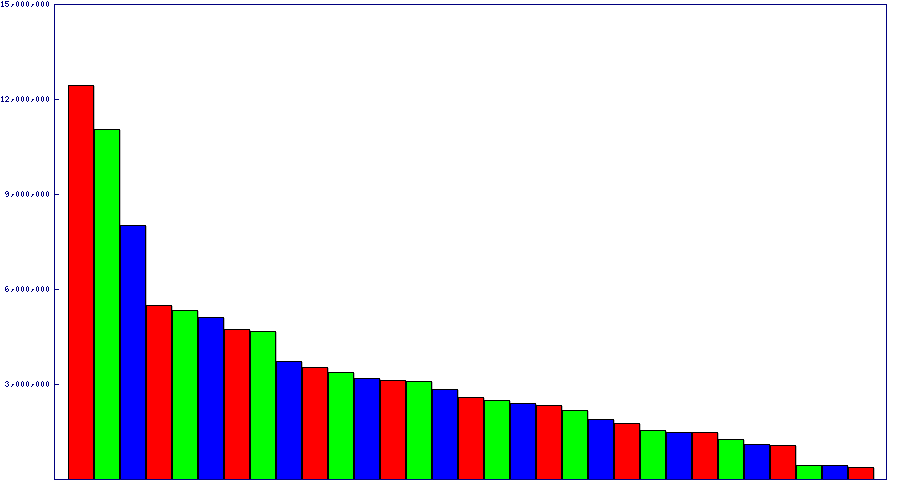
| Game Show (31 plays) | |||
| 1 | 12,437,350 | Ethan Blonder | # 5005 |
| 2 | 11,046,760 | Jacob Prince | # 5020 |
| 3 | 8,034,230 | Jacob Prince | # 5065 |
| 4 | 5,481,160 | Jacob Prince | # 5054 |
| 5 | 5,323,050 | Jacob Prince | # 5038 |
| 6 | 5,129,170 | Alexis McAndrew | # 5033 |
| 7 | 4,749,300 | Jacob Prince | # 5051 |
| 8 | 4,685,330 | Patrick Newhart | # 5006 |
| 9 | 3,742,060 | Alex Clark | # 5049 |
| 10 | 3,547,130 | Patrick Newhart | # 5002 |
| 11 | 3,382,240 | James Cooke | # 5036 |
| 12 | 3,202,200 | Jacob Prince | # 5035 |
| 13 | 3,129,260 | Jacob Prince | # 5040 |
| 14 | 3,089,120 | Andrew Batchelor | # 5027 |
| 15 | 2,853,070 | Andrew Batchelor | # 5015 |
| 16 | 2,576,070 | Jacob Prince | # 5045 |
| 17 | 2,508,080 | Nick Harris | # 5029 |
| 18 | 2,387,100 | Justin Ortscheid | # 5021 |
| 19 | 2,346,210 | Justin Ortscheid | # 5013 |
| 20 | 2,178,080 | Justin Ortscheid | # 5059 |
| 21 | 1,904,190 | Dustin Alcorn | # 5028 |
| 22 | 1,771,180 | Andrew Batchelor | # 5047 |
| 23 | 1,560,140 | Kyle Davis | # 5062 |
| 24 | 1,483,120 | James Cooke | # 5055 |
| 25 | 1,479,030 | Jacob Prince | # 5050 |
| 26 | 1,272,080 | Brodie Richardson | # 5017 |
| 27 | 1,091,060 | Kyle Davis | # 5057 |
| 28 | 1,059,020 | James Cooke | # 5061 |
| 29 | 452,090 | Justin Ortscheid | # 5012 |
| 30 | 451,050 | James Cooke | # 5052 |
| 31 | 370,000 | Brodie Richardson | # 5019 |
Total Points: 104,719,930
Mean Score: 3,378,062
Median Score: 2,576,070
Std. Deviation: 2,824,876
90th Percentile: 5,481,160